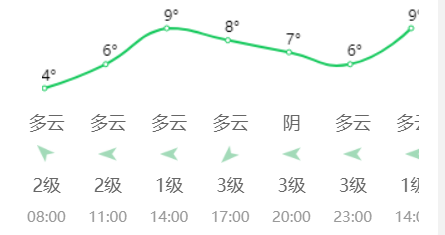
移动端天气折线图数据展示
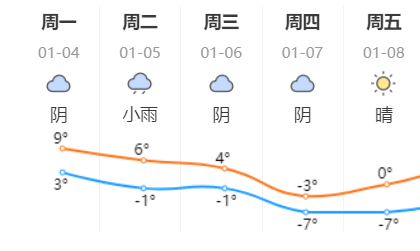
可使用 echarts 来画折线图,小程序或h5都可
(以下展示小程序使用方法)
小程序需先引入echarts
下载echarts小程序组件包
微信小程序中使用echarts
"usingComponents": {
    "ec-canvas":"/components/ec-canvas/ec-canvas"
  }
import * as echarts from '../ec-canvas/echarts';
var chart = ''
function initChart(canvas, width, height, dpr) {
chart = echarts.init(canvas, null, {
width: width,
height: height,
devicePixelRatio: dpr //解决小程序视图模糊的问题,必写
});
canvas.setChart(chart);
var option = {
color: ["#FB7821", "#1B9DFF"],
grid: {
containLabel: true,
x: -11,
x2: 15,
top: 14,
bottom: 15
},
tooltip: {
show: true,
trigger: 'axis'
},
xAxis: {
type: 'category',
boundaryGap: false,
show: false,
axisLabel: {
interval: 49
}
},
yAxis: {
min: 'dataMin',
show: false
},
series: [{
itemStyle: {
normal: {
label: {
show: true,
position: [-5, -11],
textStyle: {
color: 'black'
},
formatter: function (params) {
return params.value + '°'
}
}
}
},
type: 'line',
symbolSize: '4',
smooth: true,
data: []
}, {
itemStyle: {
normal: {
label: {
show: true,
position: [-5, 7],
textStyle: {
color: 'black'
},
formatter: function (params) {
return params.value + '°'
}
}
}
},
type: 'line',
symbolSize: '4',
smooth: true,
data: []
}]
};
chart.setOption(option);
return chart;
}
//在data中调用
data: {
ec: {
onInit: initChart
},
},获取到数据后 赋值给对应值即可
重点在与html与css的设置
<view class="dlB">
	<scroll-view scroll-x="true" class="body-module">
		<view class="body-weather-line" >
		<ec-canvas id="mychart-day-line" canvas-id="myCanvasD" ec="{{ ec }}"></ec-canvas>
	</view>
		<block wx:for="{{weatherData}}" wx:key="index">
			<view class="body-item">
				<view class="day-font">{{ item.dayWeek }}</view>
				<view class="day-time">{{ item.dayLabel }}</view>
				<view class="weather-image">
					<image src="{{item.weatherIcon}}" class="img" mode=""></image>
				</view>
				<view class="weather-font">{{ item.weatherLabel }}</view>
				<view class="weather-line"></view>
			</view>
		</block>
	</scroll-view>
</view>
.dlB {
width: 100%;
height: 400rpx;
overflow: hidden;
margin-top: 20rpx;
}
.body-module {
width: 100%;
height: 410rpx;
position: relative;
white-space: nowrap;
}
.body-weather-line {
position: absolute;
width: 608px;
height: 80px;
left: 26px;
top: 200rpx;
z-index: 1;
}
.body-item {
width: 64px;
border-right: 1px solid #f3f3f3;
display: inline-block;
}
/* .body-bg {
background-image: linear-gradient(to top, #fff 0%, #def5e7 50%, #fff 100%);
} */
.day-font {
height: 50rpx;
line-height: 50rpx;
color: #3a3a3b;
font-size: 28rpx;
font-weight: bold;
text-align: center;
}
/* .day-bgco {
background-color: #FFA800;
color: #fff;
width: 100rpx;
border-radius: 5rpx;
margin: 0 auto;
} */
.day-time {
height: 50rpx;
line-height: 50rpx;
color: #999999;
font-size: 24rpx;
text-align: center;
}
.weather-image {
height: 50rpx;
display: -webkit-box;
display: -webkit-flex;
display: flex;
justify-content: center;
}
.weather-image .img {
width: 50rpx;
height: 50rpx;
}
.weather-font {
height: 50rpx;
line-height: 50rpx;
color: #3a3a3b;
font-size: 28rpx;
text-align: center;
}
.weather-line {
height: 80px;
}同理可设置下方